1. Introduction
1.1. Background of the Study
In its most basic form, leasing is a way to offer financing. It is generally defined as "a contract between two parties wherein one party (the lessor) provides an asset for usage to another party (the lessee) for a specified period of time, in return for specified payments." In essence, leasing keeps an asset's economic use and legal ownership distinct. Leasing is a medium-term financial tool used to buy automobiles, machinery, equipment, and/or real estate. Leasing offers finance for vehicles, equipment, and assets instead of direct cash. Leasing institutions (lessors): banks, leasing firms, insurance providers, equipment manufacturers or suppliers, and nonbank financial institutions buy the equipment, typically as chosen by the lessee, and supply it to enterprises for a predetermined amount of time. The lessee pays the lessor on a regular basis at a predetermined interest rate for the term of the lease. When the lease expires, the equipment is sold to a third party, returned to the lessor, or transferred to the business's ownership. The lessee usually purchases or keeps the asset under financial leasing
| [22] | Matthew Fletcher & Rachel Freeman & Murat Sultanov & Umedjan Umarov, 2005. "Leasing in Development: Lessons from Emerging Economies," World Bank Publications - Books, The World Bank Group, number 7501, April. |
[22]
.
The largest barrier affecting SMEs, micro businesses, and new businesses in developing nations is a lack of access to financing
| [12] | Fabowale, L., Orser, B., Riding, A., and Swift, C. (1994). Gender and banking with the small business client. Canadian Woman Studies, 15(1). |
[12]
. Since World War II, asset leasing has been a part of business and industry development in the USA and Europe. The General Agreement on Tariffs and Trade (GATT), whose successor organization was the World Trade Organization (WTO), and two new international financial institutions, the International Monetary Fund (IMF) and the World Bank, were established as a result of the victorious allies' decision to establish a new international system to promote global trade and prosperity following World War II
| [24] | Mishkin, F. S. 1993. The economics of money, banking and financial markets. New York: Harper Collins. |
[24]
. Nowadays, many of companies with lots of ideas but little money are turning to leasing as an easy and adaptable financing option to boost output and make money.
One of the most talked-about business issues in the wake of global banking is financial access in many developed and developing nations
| [26] | Nair, A; et al. (2004). Leasing In Development: Guidelines For Emerging Economies, Leasing: An Underutilized Tool In Rural Finance, Agriculture And Rural Development,. Washington, DC,: International Finance Corporation, The International Bank For Reconstruction And Development, The World Bamk,. |
[26]
. In Least Developed Countries (LDCs), SMEs face disproportionate challenges in obtaining financing. Forty-one percent of SMEs in LDCs cite this as a major obstacle to their growth and development, compared to thirty percent in middle-income countries and only fifteen percent in high-income countries
| [14] | GPFI & IFC. (2011). SME Finance Policy Guide. Washington, DC. |
[14]
. However, the SME sector is a priority for many governments, who acknowledge it as a significant engine of economic growth and job creation
| [4] | CGAP & IFC. (2013). Financial Access 2012: Getting To A More Comprehensive Picture. NA: NA. |
[4]
. Since 2008, the World Bank Group of Africa leasing facility has been the main impetus behind the implementation of leasing on the African continent. By assisting in removing the primary obstacles to expansion, the facility seeks to establish a sustainable leasing industry. Lack of access to financing is the biggest obstacle facing small business owners. To support the growth of their enterprises, the appropriate equipment must be purchased. Many lack the collateral needed by most financial institutions to obtain a loan since they have little assets. One creative way to address this issue is by leasing
| [19] | IFC. (2018). Equipment Leasing In Africa Handbook Of Regional Statistics 2017. Pennsylvania Avenue, N. W. Washington, DC: IFC. |
[19]
. Similarly, SMEs in Ethiopia, like those in many underdeveloped nations, have relatively little access to financial services like bank lending. According to an IMF report, in 2012–13, the private sector (which primarily consists of SMEs) received only 21% of all banking sector loans, while the large public firms received 79% of all loans. This is because SMEs lack the credit history or collateral necessary to obtain more conventional bank financing. According to data from the World Bank's recent study on SME finance in Ethiopia, only 3% of small businesses and 23% of medium-sized businesses have a loan facility or line of credit. This is primarily because the collateral required for a loan is extremely high, accounting for 249.3% and 253.5% of small and medium-sized business loans, respectively, compared to the Sub-Saharan African (SSA) average of 160%
| [33] | World Bank. (2015). SME Finance In Ethiopia: Addressing The Missing Middle Challenge:. Washington, DC: World Bank. |
[33]
.
In the research area, there is only one capital good finance company. The Development Bank of Ethiopia Dambi Dollo Branch is the only branch of the Capital Good Finance Company. The aforementioned lease company has been using lease finance in the research area. Thus, the purpose of this study was to examine the variables influencing the involvement in lease finance and how it affects SMEs' revenue in the Kellem Wollaga zone.
1.2. Statement of the Problem and Research Questions
1.2.1. Statement of the Problem
Lack of access to financing options has an effect on SMEs' growth and other related contributions. The government has given GTP II a lot of attention in order to solve the issue of simple access to SME funding alternatives. Financial services provided by regulated financial institutions are not utilized by several significant SMEs in Ethiopia. Compared to 40.8 percent in SSA, 31.1 percent of Ethiopian firms cite credit availability as a major business constraint
| [32] | World Bank Enterprise Survey. (2011). World Bank‟S Doing Business Report. NA: World Bank. |
[32]
.
Furthermore, numerous studies have demonstrated that small and medium-sized businesses in Ethiopia lack access to bank loans or other financial services as of
| [20] | IMF. (2013). Ethiopia Country Report No. 13/308. NA: IMF. |
[20]
. This is because SMEs lack the credit history and collateral necessary to obtain more conventional bank financing. According to a World Bank
| [18] | Heckman. (1979). Heterogeneity, Aggregation, And Market Wage Functions: An Empirical Model Of Self-Selection In The Labor Market. The Journal Of Political Economy, Vol. 93, No. 6 (Dec., 1985), 1077-1125. |
[18]
study on SME finance in Ethiopia, only 3% of small businesses and 23% of medium-sized businesses have a loan facility or line of credit. This is primarily because the collateral required for a loan is extremely high, accounting for 249.3% and 253.5% of small and medium-sized business loans, respectively, compared to Sub-Saharan Africa.
Many scholars have studied the financing of DBE leases and leasing practices in various leasing companies, including Addis Capital Goods Finance Business S.C., Kaza Capital Goods Finance Business S.C., Waliya Capital Goods Finance Business S.C., Debub Capital Goods Finance Business S.C., Oromia Capital Goods Finance Business S.C., and Ethio Lease Ethiopian Capital Goods Finance Business S.C. Some of these researchers and their work are listed below. In Ethiopia, the first research on lease financing in the context of DBE and other leasing firms were conducted by
| [1] | Asfaw Abera Olana. (2016). Lease Financing In Ethiopia, Assessment Of Five Regulated Lease Financing Companies. |
| [2] | Befekadu Nigussie. (2018). Assessment Of Lease Financing In Ethiopia Among BE, ACGFC And OCGFC. (Degree Of Masters Of Science Dissertation, University Of Addis Ababa, 2018). |
| [7] | Dagnachew Nuguse. (2019). Challenges Of Small And Medium Enterprise Lease Financing: The Experience Of Development Bank Of Ethiopia. Addis Ababa: University Of Addis Ababa, 2019). |
[1, 2, 7]
, and
| [23] | Mengistu Ararsa. (2019). Challenges And Prospects Of Lease Financing Small And Medium Enterprises In Ethiopia: Evidence From Development Bank Of Ethiopia. Addis Ababa University, 2019: Addis Ababa University, 2019. |
[23]
.
The following were identified as obstacles to lease financing practice: macroeconomic instability; poor quality of SMEs' financial statements; lack of SMEs; lack of proper company policy and procedure; lack of leasing expertise in the market; lack of adequate capital goods supply chain linkages; lack of specialized lease training center; lack of stakeholder integration; lack of adequate local manufacturers; long lease processing time; issue with SMEs' selection criteria; poor bank management of credit risk; lack of low-cost and sustainable funding; and unclear interpretation of tax incentives provided by law. The supply-side elements influencing lease finance practices have been the subject of investigation by these scholars.
In addition to these, other academics have studied the factors that influence SMEs' ability to obtain financing from either the demand side or the SMEs side. These researchers included
| [13] | Fredu Negaand Edris Hussein (2016). Small and Medium Enterprise Access to Finance in Ethiopia: Synthesis of Demand and Supply, Addis Ababa, the Horn Economic and Social Policy Institute. |
[13]
have discovered that the following factors were the main barriers to SMEs' participation in finance: firm characteristics, the cost of borrowing and awareness, the inability to obtain financing on reasonable terms and conditions, the limitations of financial intermediaries, the lack of high collateral, the lack of transparency of loan conditions, the lengthy application and disbursement process, the SMEs' youth, the inexperience of their managers, the higher interest rate, ownership classification, the SMEs' lack of engagement with banks, the lack of credit information and the weak legal institution, market issues of SMEs, a lack of space, and electricity.
However, they did not address the effects of factors such as market accessibility, knowledge of lease financing, business feasibility issues, SMEs' capital, credit information asymmetry, and creditworthiness, as well as the managers' education and experience, which are major barriers to SMEs' access to financing. Moreover, difficulties associated with macroeconomic conditions, such the increase in inflation, are also cited as significant barriers. The issues are further exacerbated by bureaucracy or corruption in the public sector, inadequate pre-loan savings, firm size, the supply chain of capital goods, and the lack of financial records.
The researchers looked at a number of publications, but none of them included the impact of the previously mentioned, but crucial, factors on lease finance participation. The researcher has looked into location gap since, in addition to the aforementioned gap, no research has been done in the studied area on the same or comparable title. Additionally, several scholars have indicated that more research is necessary to understand the demand-side or SMEs-side elements that influence lease finance participation
| [7] | Dagnachew Nuguse. (2019). Challenges Of Small And Medium Enterprise Lease Financing: The Experience Of Development Bank Of Ethiopia. Addis Ababa: University Of Addis Ababa, 2019). |
[7]
and
| [23] | Mengistu Ararsa. (2019). Challenges And Prospects Of Lease Financing Small And Medium Enterprises In Ethiopia: Evidence From Development Bank Of Ethiopia. Addis Ababa University, 2019: Addis Ababa University, 2019. |
[23]
. However, these researchers did not include certain crucial econometric models in their study, such as propensity score match (PSM). The researcher has so looked into methodological gaps. Thus, the purpose of this study is to close the research gap by integrating the overlooked but crucial variables to examine the factors influencing the involvement in lease financing and how it affects the income of SMEs in Kellem Wollega zones.
1.2.2. Research Questions
1) What are factors that influence SMEs to participate in lease financing practice?
2) To what extent SMEs participate in lease financing?
3) What are the consequence /impact of lease financing on income of SMEs?
1.3. Objective of the Study
1.3.1. General Objective
The general objective of this study is to examine the factors affecting lease financing participation and its effect on income of SMEs in of Kellem Wollaga zone.
1.3.2. Specific Objectives
The specific objectives of this study are:
1) To investigate factors that influence SMEs to participate in lease financing practice;
2) To analyze extent of SMEs participate in lease financing;
3) To examine the consequence of participation in lease financing on income of SMEs.
1.4. Significance of the Study
The study's main contribution is to assist SMEs in the study region and in general in evaluating the practice of lease financing and identifying the elements that contribute to SMEs' successful lease financing practices. It can help current business owners and the Small and Medium Enterprise (SME) Development Agency remove obstacles that SMEs face in the manufacturing industry. In addition to helping the researcher obtain new information and abilities, this study serves as a resource for those who wish to learn more about the evaluation of SMEs' lease financing practices in DBE in the future. All things considered, the study helps researchers, policymakers, executive officials, and other stakeholders identify the gaps in SMEs' performance and limitations. Development interventions that take into account the study's findings can effectively promote the appropriate performance of SMEs that are the subject of additional investigation.
1.5. Scope of the Study
Factors influencing lease financing participation and capital goods financing business application in DBE of Dambi Dollo Branch are the primary subject of the study. Particular attention was paid to the Kellem Wollaga zone in this investigation. Only the factors influencing lease financing participation and its impact on small and medium-sized businesses' revenue in the Kellem Wollaga Zone are the subject of this study. Additionally, as a study drawback, the data used is cross-sectional, which affects the factors influencing SMEs' participation in lease finance and its impact on SMEs' revenue.
3. Research Methodology
In this chapter, description of the study area, sampling method and sample size, data type, data sources and method of data collection, method of data analysis, description of variables and hypothesis are presented.
3.1. Descriptions of the Studded Area
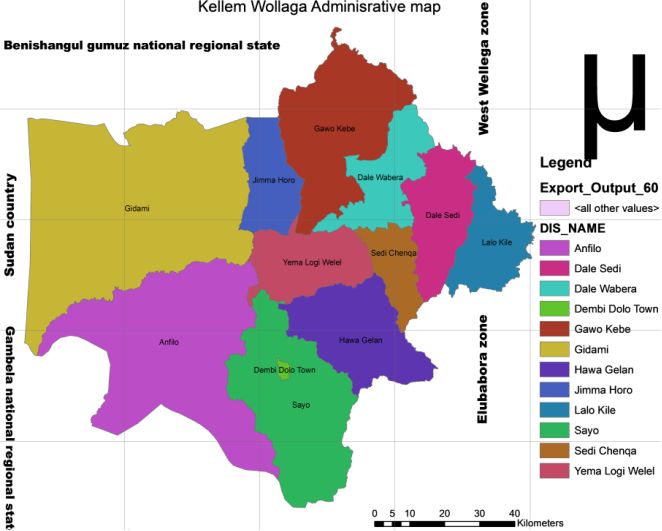
With a total area of 9,287.55 km2, the Kellem Wollaga zone is the 13th largest zone in Oromiya and makes up roughly 2.9% of the country's total area. It is situated between latitudes 8°10'58"N and 9°21'53"N and longitudes 34°07'37"E and 35°26'53"E. West Wollaga borders it on the north and east, Benishangul Gumuz borders it on the north-west, Ilubabor Zone borders it on the south and south-east, Gambella borders it on the west and south-west, and Sudan borders it on the west. The capital of the zone is Dambi Dolo, which developed at a rather high rate of urbanization under the Italian rule. Dambi Dolo is almost 652 kilometers away from Addis Ababa. Kellem Wollaga is divided into 11 rural districts, 1 administrative town, 256 rural districts, 23 urban districts, and a total of 279 districts.
The Kellem Wallaga zone's predicted population of 1,191,583 as of July 2023 was spread across an area of roughly 9287.55 km2. There are 597,930 males and 593,652 females overall, resulting in an average crude density of roughly 128.29 people per km2. Districts differ greatly from one another, nevertheless.
Figure 2. Kellem Wollaga Zone Map.
Source:- Kellem Wollaga Zone Finance and Economic Development Office: Socioeconomic profile of the Zone
3.2. Sampling Method and Sample Size
The fundamental sampling unit was SME. To produce the necessary primary data for this investigation, a two-stage sampling procedure was employed. In the initial phase, five districts were chosen at random from a total of eleven districts and the town of Dambi Dollo. On the second stage, after creating a sample frame of participants and non-participants in the chosen district, 384 sample SMEs were chosen using a probability proportional to sample size sampling procedure. Of these, 77 participants and 307 non-participants were chosen at random. However, because of missing data, 98 observations of which were non-participants and zero participants were not included in the study.
As a result, in the second stage, after creating a sample frame of participants and non-participants in the chosen district, 286 sample SMEs were chosen using a probability proportional to sample size sampling procedure, from which 77 participants and 209 non-participants were chosen at random. Given that the district is relatively homogeneous in terms of climate, resource endowment, and other aspects pertaining to the study's topic, it is presumed that this sample size accurately represents the population. The sample size determination formula, which follows
| [5] | Cochran, W. G. (1977). Sampling techniques. John Wiley & Sons. |
[5]
and adjusts the degree of precision to 0.05 (5%), has been used to determine the representative sample from the study area. Additionally, the proportionality formula was used to establish the sample size from each district. Consequently, formula
| [1] | Asfaw Abera Olana. (2016). Lease Financing In Ethiopia, Assessment Of Five Regulated Lease Financing Companies. |
[1]
determines the sample size.
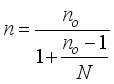
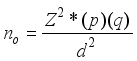 (1)
(1) Where n= sample size
Z= Standard normal deviation (1.96 for 95% confidence level)
P=0.5 (The proportion of the population participating in lease financing, that is 50%) due to unknown variability
q = 1-P =0.5 (50%)
d = desired degree of precision, (0.05) (5%) in this case
 (2)
(2) The sample was chosen using the proportional sampling technique from each of the five districts as well as the town of Dambi Dollo. Formula (
3) was used to determine the sample size from each town and district, which was proportionate to the sample population in each district.
 (3)
(3) Where ni - the sample to be selected from i’s District.
Ni- the total population living in selected i’s District.
∑- The summation sign
∑ Ni– The sum of total population in the selected five district and Dambi Dollo town
n – total sample size
Table 1. Distribution of sample size by district.
No | Name of the District in the Zone | Total Number of SMEs | Sample selected (Non Participant/ Participant) | Proportion |
1 | Gidami | 135 | 39 | 14% |
2 | Jimma Horro | 114 | 33 | 11% |
3 | Seyyo | 146 | 42 | 15% |
4 | Anfilo | 61 | 17 | 6% |
5 | Lalo Kile | 113 | 32 | 11% |
6 | Dambi Dollo Town | 431 | 123 | 43% |
Total | 1000 | 286 | 100 |
Source: Survey data, 2025
3.3. Types of Data, Data Sources and Methods of Data Collection
Primary and secondary sources of quantitative and qualitative data were gathered for this investigation. The sample SMEs in the Kellem Wollega district served as the primary source of data, while local offices, higher governmental entities, various publications, and policy documents served as the secondary sources. A semi-structured questionnaire comprising both closed-ended and open-ended questions was employed as a tool to gather primary data from the sample SMEs. A variety of topics were covered in the questionnaire in order to gather information on the factors influencing the participation in lease financing and its impact on the income of small and medium-sized businesses in the Kellem Wollaga Zone. These topics included: the market's accessibility; access to electric service; awareness of lease financing; business feasibility issues; the SMEs' capital and credit worthiness; the managers' educational level and experience; poor pre-loan savings; the rise in inflation; the size of the firms; and corruptions as obstacles that exacerbate the issues.
Enumerators who could speak the local languages and had at least a secondary education were chosen to collect primary data. The enumerators were recruited with the utmost care. They received thorough instruction on how to collect data, conduct interviews, and understand the specifics of the questionnaire. To effectively communicate the questions to the rural interviewees, the SMEs' questionnaire was translated into the local language (Afaan Oromoo). Trained and experienced enumerators pre-tested, administered, and filled it out. Throughout the survey, the researcher exercised strict oversight.
In addition to journal papers available at government offices, SME offices, and credit associations, secondary data was gathered from publications and documents of various organizations and pertinent local offices. Additionally, all available documents, including policies, plans, guidelines, and studies, that are pertinent to the financing of leases for SMEs have been examined. The research area conducted focus groups and key informant interviews to gather pertinent and comprehensive data regarding the factors influencing lease financing participation and its impact on the income of small and medium-sized businesses in the Kellem Wollaga Zone. Data was gathered via unstructured interviews (guiding questions) for both focus groups and key informant interviews.
3.4. Methods of Data Analysis
3.4.1. Descriptive Statistics
The various elements influencing lease finance participation and its impact on the income of small and medium-sized businesses in the Kellem Wollaga Zone were explained in this study using descriptive statistics. For this investigation, descriptive statistics including mean, standard deviation, minimum, and maximum were employed. Chi-square (χ2) and student t-test statistics were used to examine the statistical significance of the continuous and contingency variables, as well as the dummy variables.
3.4.2. Econometric (Inferential) Model Specification
(i). Probit Model Specification
The degree to which SMEs participate in lease finance and the severity of their involvement are the study's dependent variables. Due to the dichotomous (binary) nature of one of the study's dependent variables, the SMEs' participation in lease financing, it takes a value of 1 if the SME has engaged in lease financing and 0 otherwise. If the study's focus is solely on SMEs' involvement in lease financing, then either the binary logit or binary probit model can be used.
Logit or probit models are frequently used to analyze determinant studies for a small number of dependent variables, as Gujarati states, and the results are comparable. On the other hand,
| [15] | Greene, W. H. (2003): Econometric Analysis. New York University, New York. |
[15]
contends that although if the outputs from both models are comparable, the logit model is simpler to estimate. However, this is no longer an issue because computer software can do the task in a matter of seconds. Only the examination of the likelihood of participation in a specific technology is done using these two models
| [10] | Dehejia, R. H. and Wahba, S. (2002) Pro-pensity score matching methods for nonexperimental causal studies. |
[10]
.
Binary logit or binary probit models can be used to analyze the SME's decision to participate in lease finance practices
| [31] | Wooldridge. (2002). Econometric Analysis Of Cross Section And Panel. |
[31]
. Because the logit and probit models are so similar, they typically produce nearly equal predicted probabilities. However, the probit model is more widely used in econometrics than the logit model because of the error term's favorable normality assumption and the fact that the normal distribution's features make it easiest to examine a number of specification problems
| [6] | Creswell, J. (2009). Business Research Methods: Qualitative, Quantitative, And Mixed Methods, 2nd Edition,. California: Sage Publisher, California. |
[6]
. These benefits led the researcher to select the probit model over the logit model in order to accomplish the goal of lease financing participation.
(ii). Heckman Two-step Model Specification
It was believed that SMEs' involvement in lease finance would determine the level of participation. Based on this presumption, the Tobit model, which was first proposed by Tobin, was intended to be used to analyze the factors that influence SMEs' participation in lease financing. It does this by estimating the probability and intensity of participation using a single coefficient estimate. However, following data collection, the Heckman two-step approach was used for estimate. The results showed that the Inverse Mills Ratio (IMR) was considerable, indicating that there was a large bias in sample selectivity and that the Heckman two-step procedure was appropriate.
Heckman corrected sample selectivity bias with a two-step estimation processes model. Heckman two-step estimate procedures are useful when two decisions are involved, such as participation and supply volume. Therefore, the Heckman two-stage model was utilized to attain the goal of intensity of participation
| [11] | EIC. (2020). Investing In Ethiopia’s Leasing Sector, Addis Ababa, Ethiopia. Ethiopia: Ethiopian Investment Commission. |
[11]
. The Heckman two-stage selection approach included two steps to ascertain the factors determining the degree of involvement in lease financing;
First, a probit model is used to estimate the selection equation and forecast the likelihood that SMEs will engage in lease finance or not.
The second stage equation, which discusses the factors influencing the supply of machinery, is an outcome equation derived using Heckman second stage regression.
Where Pr is an indicator variable SMEs that participated in lease financing,
Zi; is the standard normal cumulative distribution function,
a; is the vector of factors affecting the decision to participate in lease financing,
α; is the vector of coefficients to be estimated, and
εi; is the error term assumed to be distributed normally with a mean of zero and a variance ϕ.
The variable takes the value of 1 if the marginal utility the SME i get from participating lease financing is greater than zero, and zero otherwise. This is shown as follows.
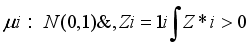 (6)
(6) Where Z *i is the latent level of utility the SMEs get from participating in the lease financing,
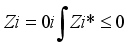 (7)
(7) To account for any selection bias, more repressors are added to the supply equation in the second stage. The Inverse Mills Ratio (IMR) is this repressor. The IMR is calculated as follows:
 (8)
(8) Where ϕ is the normal probability density function. The second-stage equation is given by
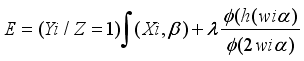 (9)
(9) Where β is the vector of the relevant coefficients to be estimated, X is a vector of independent factors influencing the quantity of machinery supplied, Y is the (continuous) proportion of machinery supplied, and E is the expectation operator. Yi can therefore be written as follows:
 (10)
(10) Yi is only observed for those machineries of SMEs that participates in lease financing where
, in which case
Yi= Yi In the initial stage of determining whether or not to engage in lease finance, the model can therefore be estimated as follows. This can be described as:

(11)
X1--- Xn is a vector of explanatory variables, β0 is a constant, β1…..βn are parameters to be evaluated, and participation is represented by 1 and non-participation by 0. An OLS is used to estimate the second stage, which entails deciding how much lease financing participation is necessary, as follows:
 (12)
(12) The variables to be employed in Heckman two stages are displayed, where Y represents the proportion of machinery supply, β0 is a constant, β1….. βn are parameters to be estimated, and X1, ----- Xn are vectors of explanatory factors.
Step 1. (Selection equation)
 (13)
(13) Step 2. (Outcome equation)
Proportion of supply of Machineries

(14)
Where,
A. Dependent variable
P (0, 1) = probability of SMEs lease financing participation and non-participation, Dummy (1= participant, 0 = Non-participant)
Extent
Yi = extent of participation (Proportion Machineries supplied)
B. Independent variables
X1 = Education level (Category, 1 if 9-12th grade, 2 if diploma and 3 if degree and above)
X2 = Experience (continuous, measured in years)
X3 = Size (continuous measured by number of Employers)
X4 = Capital (continuous, measured by ETB)
X5 = Access to the Market (measured by accessibility of the Market)
X6 = Inflation (Dummy, 1 access, 0 otherwise)
X7 = Pre loan saving (Dummy, 1 if there is pre loan saving and 0 other wise)
X8 = Credit worthy (Dummy, 1 if there is credit worth and 0 otherwise)
X9 = Corruptions (Dummy, 1 if there is corruptions and 0 otherwise)
X10= Awareness of lease financing (Dummy; 1 if awarded and 0 otherwise)
X11 = Access to electric services (Dummy, 1 if access to electric, and 0 otherwise)
X12 = Business feasibility, (Dummy, 1 if business is feasible and 0 otherwise)
β = Co-efficient and ε error terms
Before running the models, diagnostic tests such as goodness-fitness, inverse mills ratio, and correlation and multicollinearity problems were checked.
(iii). Impact (Consequence) of Evaluation Strategies
For this study, in examining the influence of Lease finance participation on the income of SME, propensity score matching (PSM) has been adopted for numerous reasons. First off, unlike many impact evaluation research projects, there was no baseline data on participants and nonparticipants. Second, the people who take part in lease financing could choose to do so on their own. Additionally, a cross-sectional survey served as the basis for the field data that was accessible.
The interest of the impact section of this study was establishing the average treatment effect on the treated (ATT) of lease finance participation. However, the lack of baseline data makes it impossible to estimate this effect using before and after data; instead, the mean outcome of untreated patients must be used to replace the counterfactual mean of treated patients
| [3] | Caliendo, M., & Kopeinig, S. (2005). Some Practical Guidance for the Implementation of Propensity Score Matching. |
[3]
. Although it is feasible, it will be a biased estimator under selectivity biasness both with and without data. Because PSM offers a suitable answer, it was utilized to address this issue
| [27] | Rosenbaum, P., and D. Rubin (1983): The Central Role of the Propensity Score in Observational Studies for Causal E ects, Biometrika, 70, 4150. |
[27]
. It takes into consideration sample selection bias brought on by discernible variations between the comparison and treatment groups. By matching each SME observation from the treatment group with SME observations from the control group that have comparable observable traits, it creates a statistical comparison group to account for self-selection. The average treatment effect on the treated (ATT) was calculated in order to measure the impact of lease finance participation on SME income. Given the observable data, the average treatment effect (ATE) is represented by:
 (15)
(15) T = 1 denotes SMEs that took part in lease financing (referred to as the treated), and T = 0 denotes SMEs that did not participate in lease financing (referred to as the untreated or control). Here, Y1 is the income of SMEs that took part in lease financing, and Y0 is the income of SMEs that did not participate in lease financing. Anang et al. (2020) state that in the event of a randomized design (i.e., without selection bias), E (Y1 | T = 1) − E (Y0 | T = 0) equals zero.
Nevertheless, the ATE result from equation (
15) offers a skewed estimate of the effect of lease financing participation on SMEs' income when selection bias is present. The average treatment effect on the treated (ATT) must therefore be estimated using observational data and conditioning on a vector of lease finance participations and SMEs characteristics X in order to overcome this bias.
 (16)
(16) However, the counterfactual E (Y0│X, T=1) is unobservable, hence assumptions are made to estimate it as follows:
 (17)
(17) The efficacy of treatment on PSM patients can be ascertained using a variety of matching methods. However, according to
| [3] | Caliendo, M., & Kopeinig, S. (2005). Some Practical Guidance for the Implementation of Propensity Score Matching. |
[3]
, the most used matching algorithms in PSM are kernel, radius, and nearest neighbor matching. To ascertain the average impact of a particular program participation or intervention, these matching techniques employ various techniques to match the treated group to the control group.
The impact of SME participation in lease financing was estimated using the three matching algorithms mentioned above. The best of the three was chosen after testing the three most used PSM algorithms. However, there is no precise guideline for figuring out which algorithm is better suited for a certain situation. One significant concern, nevertheless, has been that choosing the matching algorithm entails a trade-off between bias and efficiency. For example, we ensure that we are utilizing the most similar observation to generate the counterfactual by employing only one nearest SME.
Because the features of the two units are generally rather comparable, this reduces the bias. However, because many untreated units are not considered for the estimation, this technique overlooks a large amount of sample data. Consequently, a loss in efficiency results from a reduction in bias, which is accompanied by an increase in the imprecision of the estimates due to a higher variance. However, the estimator is more effective when employing several SME because it uses more information from the untreated pool; however, this comes at the cost of picking worse matches, which increases bias.
The most crucial tests to simultaneously lessen bias and inefficiency guided the selection of the matching algorithms. These tests include the number of balanced covariates, the mean bias, the number of matched samples, and the pseudo R square value. The best matching algorithm is the one with the lowest mean bias when mean bias is taken into account. The sample with the largest matched number of observations is the best and is chosen based on the number of matched samples. In terms of the pseudo R square value following matching, the optimal matching method is the one with the lowest pseudo R square. However, it is more preferable to use the matching algorithm that has the most balanced covariates. In order to ascertain the impact of SMEs' involvement in lease financing on their revenue, the nearest neighbor matching algorithm was chosen based on the criteria's overall test.
3.5. Description of Variables and Hypothesis
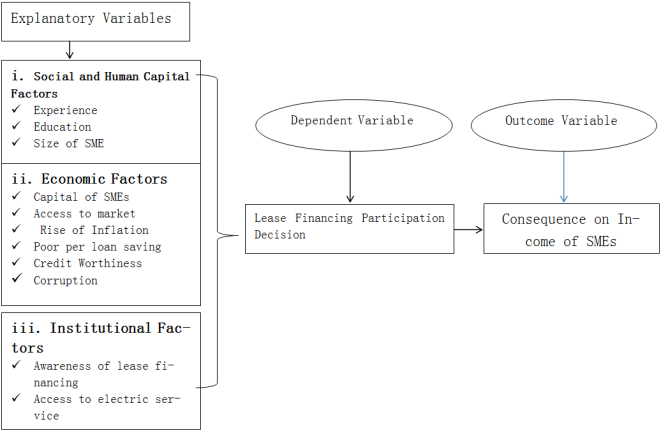
3.5.1. Dependent Variables
Participation decision of SMEs in Lease financing participation
The first dependent variable was participation in lease finance taking value of 1 if the SMEs participated and 0 if not participated in lease financing. The main intension here is to identify the factors affecting (determining) the participation of the SMEs in lease financing in general.
Intensity (Extent) of participation of SMEs in lease financing
This variable is a continuous variable measured in terms of proportion of participation of SMEs. It represents the actual proportion of machineries supplied of SMEs in 2023.
3.5.2. Outcome Variable
This continuous variable shows the entire amount of money made by SMEs annually, expressed in Birr. It was predicted that participating in lease finance would increase the income of the participating SMEs.
3.5.3. Explanatory Variables
There is no fundamental rule governing which variables belong in the model for explanatory variables (Anderson et al., 2009). In order to determine which independent factors affect SMEs' involvement in lease finance, the study was founded on economic theory and earlier empirical research. Thus, the following defines and hypothesizes the repressors that are most frequently reported to effect leasing financing participation, whereas
Table 2 summarizes the predicted signals and hypotheses.
(i). Social and Human Capital Characteristics
Educational status of the SME’s manager: This variable is categorical, taking 1 if the managers' educational background is 9–12, 2 if they have a diploma, and 3 if they have a degree or higher. According to many researches, SMEs with literate managers are more likely than their uneducated counterparts to engage in lease finance.
Experience of the SMEs manager: It is continuous variable. Based on the DBE due delegacy format (2015) and the prior research analysis by
| [13] | Fredu Negaand Edris Hussein (2016). Small and Medium Enterprise Access to Finance in Ethiopia: Synthesis of Demand and Supply, Addis Ababa, the Horn Economic and Social Policy Institute. |
[13]
, it is anticipated to have a favorable relationship with lease financing methods.
Size of SME: This continuous variable is expressed in terms of an employer's number. Evidence suggests that SMEs with a higher number of employers engage in lease finance at a higher rate than their counterparts. A high number of employers might occasionally be interpreted as a sign of social standing. Because of their social standing, those SMEs might be more inclined to engage in lease financing in order to preserve their standing in the community. Thus, this variable was anticipated to have a favorable impact on SMEs' lease finance involvement and to influence their participation without predicting the direction.
(ii). Economic Characteristics
Capital of the SMEs: This variable, which is the total capital expressed in Ethiopian Birr, is continuous. Research indicates that this variable has a favorable and significant impact on SMEs' involvement in lease financing
| [2] | Befekadu Nigussie. (2018). Assessment Of Lease Financing In Ethiopia Among BE, ACGFC And OCGFC. (Degree Of Masters Of Science Dissertation, University Of Addis Ababa, 2018). |
[2]
. The likelihood of SMEs participating in lease financing increases with their overall capital. This might be the case if SMEs with more capital are able to pay for administrative expenses more readily than those with less money. Compared to SMEs with lower capital, those with greater capital can more readily purchase the inputs needed for fatherly manufacturing. This characteristic was therefore thought to have a favorable impact on the SMEs' decision to participate and the degree of that engagement.
Accessibility to Market: This variable is dummy and takes on a value of 1 if the SME has market access with regard to the product's pricing and demand, or 0 if the SME does not have market access and produces all of its goods without market accessibility. Numerous research have revealed that this variable has a favorable and significant impact on SMEs' decisions to participate in lease finance
| [21] | Kinfe, A., Chilot, Y., & Rajan, S. 2012. Effect of small-scale irrigation on the income of rural farm households: the case of Laelay Maichew district, central Tigray, Ethiopia. Journal of Agricultural Science, 7(1). |
[21]
. This might be interpreted as allowing SMEs to profit from production under lease finance due to market accessibility, including input and output prices. SMEs may not be motivated to produce if they are unable to access the market for the product because they are unaware of the potential profit or loss from production. As a result, it was predicted that this variable will favorably affect the percentage of SMEs that participate in lease finance.
Rise of inflation: It is a dummy variable that returns 0 otherwise and 1 if an increase in inflation has an impact on SMEs' participation in lease financing. For investors, inflation can have a variety of effects. Asset devaluation can lower an investor's profits in addition to decreasing their purchasing power. Investors may have less money to invest and their current assets, including retirement funds, may lose value if essentials become more expensive. Many businesses find it difficult to fully pass on price increases for raw materials to their clients, which can lower profitability. It is anticipated that lease finance techniques will have a negative relationship with these different dynamic forces since investors seek safer investments in the current economic environment.
Poor pre-loan saving: This variable is Dummy variable, which has value 1 if SME per-loan saving is poor and 0 otherwise. Evidences
| [21] | Kinfe, A., Chilot, Y., & Rajan, S. 2012. Effect of small-scale irrigation on the income of rural farm households: the case of Laelay Maichew district, central Tigray, Ethiopia. Journal of Agricultural Science, 7(1). |
[21]
show that this variable is negatively and significantly affecting the participation of the SMEs in lease financing. The poorest the per-loan saving of the SMEs, the higher the probability of not participation in lease financing of SMEs. Therefore, this variable was hypothesized as influencing the participation decision of the SMEs and its intensity positively.
Access to credit worthy of SMEs: It is a dummy variable that returns 0 otherwise and 1 if the borrower is creditworthy for lease finance. According to
,
9], lease financing methods are anticipated to have a negative relationship.
Corruption: This dummy variable has a value of 1 for lease finance corruption excites and 0 otherwise. It accomplishes this by calculating the effect that corruption has on businesses' ability to secure licenses, permits, and other licenses, as well as the likelihood that these businesses may encounter financial constraints. Our findings show a strong positive correlation between a firm's likelihood of financial constraints and higher levels of corruption. In other words, more corruption has a negative effect on the company's ability to obtain funding.
(iii). Institutional Characteristics
Awareness of lease financing: It is a dummy variable that returns 0 otherwise and 1 if you are aware of or informed about lease finance. Lack of knowledge regarding how lease financing affects funding SMEs is predicted to have a positive relationship with lease financing practices, according to a prior literature analysis by
| [25] | Mohammad Salam Al-Shiab, Determinants of Financial Leasing Development in Jordan, studies in business and economics, Vol. 14 No. 2. 25-50. |
[25]
.
Business feasibility problem:- Access to financing and a company's business planning are positively correlated. To obtain financial support, entrepreneurs submit a formal document known as a business plan to a bank or other financial institution. A business plan is a thorough analysis of the operations of a firm. It provides information about the organization's past state of affairs, present situation, and future goals
| [30] | Ward, J. L. (1987) Keeping the Family Business Healthy: How to Plan for Continuous Growth, Profitability, and Family Leadership. Jossey-Bass, CA. |
[30]
. Information opacity is always the result of inadequate company strategy. The company's ability to obtain outside funding may be hampered by this circumstance
| [12] | Fabowale, L., Orser, B., Riding, A., and Swift, C. (1994). Gender and banking with the small business client. Canadian Woman Studies, 15(1). |
[12]
. Thus, in small and medium-sized businesses, there should be a positive correlation between business strategy and outside funding.
Access to Electric Power: It is a dummy variable that returns 0 otherwise and 1 if electricity is available. It is anticipated to have a favorable relationship with lease finance procedures, according to the DBE lease financing procedural manual
| [6] | Creswell, J. (2009). Business Research Methods: Qualitative, Quantitative, And Mixed Methods, 2nd Edition,. California: Sage Publisher, California. |
[6]
.
Table 2. Lists of variables definition and measurement.
No | Variables | Symbol | Status | Type | Measurement |
1 | Lease Financing Participant | LFP | Dependent | Dummy | Takes 1 if participate in lease financing; 0 other wise |
2 | Intensity | MSupp | Dependent | Continuous | Number of Machines |
3 | Income from lease financing | Income | Out come | Continuous | In Birr |
1 | Access to market | AcctMar | Independent | Dummy | Takes 1 if Access to the Market; 0 other wise |
2 | Access to Electric power | AccEct | Independent | Dummy | Takes 1 if Access to Electric power; 0 other wise |
3 | Awareness of lease financing | Awa | Independent | Dummy | Takes 1 if there is an awareness; 0 other wise |
4 | Business feasibility problem | Feas | Independent | Dummy | Takes 1 if there is business feasibility problem; 0 other wise |
5 | Capital of SMEs | Cap | Independent | Continuous | In Birr |
6 | Corruptions | Corru | Independent | Dummy | Takes 1 if there is Corruptions; 0 other wise |
7 | Credit worthy of SMEs | Crwor | Independent | Dummy | Takes 1 if there is Credit worthy of SMEs; 0 other wise |
8 | Education level of the SMEs managers | Educ | Independent | Continuous (categorical) | In Level of education |
9 | Experience of the SMEs managers | Exper | Independent | Continuous | In number of Years |
10 | Poor pre-loan saving | Prelosa | Independent | Dummy | Takes 1 if there is Poor pre-loan saving; 0 other wise |
11 | Rise of inflation | Infl | Independent | Dummy | Takes 1 if there is effect of Rise of inflation; 0 other wise |
12 | Size of Firm | Size | Independent | Continuous | In number of Employers |
4. Results and Discussions
Discussion of the findings from both qualitative and quantitative examination of the survey data is the focus of this chapter. As a result, it covers the descriptive and econometric analyses of economic, social, and human capital, as well as institutional, aspects in connection to the degree and impact of lease finance participation on income in the research area.
4.1. Descriptive Statistics Results
Using descriptive statistics like mean, percentage, and standard deviation as well as inferential statistics like chi-square X2 for categorical and dummy and t-tests for continuous variables, this section presents the descriptive results of the economic, social, and human capital and institutional characteristics of the sample respondents.
4.1.1. Social and Human Capital Characteristics
Education Level: Among participants and non-participants in lease financing, this variable was examined as an insignificant categorical variable. 35.31%, 46.51%, and 18.18% of the sampled respondents were in the 9–12 grade, had a diploma, and had a degree, respectively. The chi-square test revealed that, at the 5% significance level, there was no discernible difference in the managers' educational backgrounds (
Table 4). However, some researchers' findings differ from this one. According to their findings, SMEs with literate managers are more likely than their illiterate counterparts to engage in lease finance
| [3] | Caliendo, M., & Kopeinig, S. (2005). Some Practical Guidance for the Implementation of Propensity Score Matching. |
[3]
.
Experience of SMEs managers: The average number of years that managers had worked for SMEs in the research area was 5.51. According to
Table 3, the mean managing experience of the participants was 10.04 years, whereas that of the non-participants was 3.85 years. At the 1% level of significance, the t-test data show a significant difference in the management experience between participants and non-participants. According to the results, non-participants had a worse managing experience than participants. This suggests that SMEs are more likely to engage in lease finance if their managers have more experience.
Size of the firm: Lease financing participants had an average of 15.77 employees, while non-participants had an average of 11.70 employees. The data result showed that there was a mean difference in firm size between the two groups, with lease financing participant SMEs having more employees than non-participants. The tabulated value of the t-test indicated that the size of the firm was statistically significant between participants and non-participants at the 1% level of significance.
4.1.2. Economic Characteristics
Capital of SMEs: The sample SMEs in the study area had a mean capital of Birr 306,791.3, with a minimum and maximum capital of Birr 100,000 and 2,500,000, respectively. With a lowest and maximum capital of Birr 100,000 and 1,400,000, respectively, the mean capital of the non-participants was Birr 190,542.1, whereas the participants' capital was Birr 622,324.7, with minimum and maximum capitals of Birr 100,000 and 2,500,000, respectively. The capital of the SMEs differed significantly between participants and non-participants, according to the t-test results. At the 1% significance level, the mean difference between the participants and non-participants was noteworthy. This suggests that the participants' capital was greater than that of the non-participants (
Table 3).
Access to market: In the research area, market accessibility for SMEs was also examined for both participants and non-participants in lease finance. According to the entire observation, 53.15% of respondents have access to the market through lease financing, whereas 46.85% of respondents do not. 6.77 percent of non-participants and 9.09% of participants, respectively, lack market accessibility. At the 1% level of significance, the chi-square value shows that there was a highly significant difference in market accessibility with regard to lease finance between participants and non-participants (
Table 4).
Table 3. Summary statistics of continuous Variables and t-Test.
Variables | Non Participants = 209 | Participants = 77 |
Mean | Std. Dev. | Min | Max | Mean | Std. Dev. | Min | Max |
Cap | 190,542.1 | 128,840.8 | 100,000 | 1,400,000 | 622,324.7 | 470,517.5 | 100,000 | 2,500,000 |
Exper. | 3.85 | 2.499 | 1 | 14 | 10.04 | 3.435 | 1 | 18 |
Size | 11.70 | 5.570 | 5 | 25 | 15.77 | 7.001 | 5 | 30 |
Variables | Total = 286 | Mean diff. | P-Value |
Mean | Std. Dev. | Min | Max |
Cap | 306,791.3 | 328,573.8 | 100,000 | 2,500,000 | -431,782.6 | 0.0000*** |
Exper. | 5.51 | 3.901 | 1 | 18 | -6.19 | 0.0000*** |
Size | 12.80 | 6.243 | 5 | 30 | -4.06 | 0.0000*** |
Legend: * p<0.05; ** p<0.01; *** p<0.001
Source: Own computation from the survey data, 2025.
Rise of Inflation: Analysis of the increase in inflation on leaser financing was also done for both participants and non-participants of the sample SMEs in the study area. 55.24% of respondents, including those who did not participate, said that SMEs are not affected by inflation, and the remaining 44.76% did not mention any impact of rising prices. Participant and non-participant reports of the impact of inflation on SMEs are 54.07% and 58.44%, respectively. Inflation on lease finance did not significantly differ between participants and non-participants, according to the chi-square value (
Table 4).
Poor pre loan saving: According to
table 4, almost 62.94% of respondents said that their SMEs did not have inadequate pre-loan savings. There was no poor pre-loan saving, according to 51.20% of lease finance non-participants and 94.81% of participants, respectively. Poor pre-loan saving was also statistically significant between participants and non-participants, according to the tabulated chi2 value at the 1% significance level.
Credit worthy of SMEs: This variable, which was examined in both participants and non-participants, was another important discrete variable. The existence of creditworthy SMEs was reported by roughly 59.09% of the sampled respondents. Participants and non-participants reported that their SMEs had creditworthy individuals in 75.32% and 53.11% of cases, respectively. According to
table 4, the chi-square test revealed a significant difference between participants and non-participants at the 5% significance level. The results of the study are comparable to those of other studies, including
| [25] | Mohammad Salam Al-Shiab, Determinants of Financial Leasing Development in Jordan, studies in business and economics, Vol. 14 No. 2. 25-50. |
[25]
. In the research area, he said, there is a favorable difference in credit worthiness between participating and nonparticipant SMEs. The Pearson chi2 test indicates that it is statistically significant at the 1% significance level.
Corruptions: Approximately 71.68% of the respondents stated that corruption exists in their SMEs, as shown in
table 4 On the other hand, 76.62% of participants and 69.86% of non-participants in lease finance, respectively, stated that corruption existed. According to
Table 4, the chi-square value shows that there was no discernible variation in the corruption variable between participants and non-participants.
Table 4. Distribution of the Dummy and category Variables and Chi-square.
Variables | Non Participants | Participants | Total | p-value | Chi2 Value |
Frequency (proportion/%) | Frequency (proportion/%) | Frequency (proportion/%) |
Access to market | Not access =0 | 127 (60.77%) | 7 (9.09%) | 134 (46.85%) | 0.000*** | 60.3406 |
Access =1 | 82 (39.23%) | 70 (90.91%) | 152 (53.15%) |
Total | 209 (100%) | 77 (100%) | 286 (100%) |
Awareness of lease financing | Not aware = 0 | 110 (52.63%) | 53 (68.83%) | 163 (56.99%) | 0.014** | 6.0245 |
Aware = 1 | 99 (47.37%) | 24 (31.17%) | 123 (43.01%) |
Total | 209 (100%) | 77 (100%) | 286 (100%) |
Feasibility problem | No Feasibility problem = 0 | 64 (30.62%) | 74 (96.10%) | 138 (48.25%) | 0.0000*** | 96.6284 |
Feasibility problem =1 | 145 (69.38%) | 3 (3.90%) | 148 (51.75%) |
Total | 209 (100%) | 77 (100%) | 286 (100%) |
Corruption | No corruption = 0 | 63 (30.14%) | 18 (23.38%) | 81 (28.32%) | 0.260 | 1.2692 |
Presence of corruption = 1 | 146 (69.86%) | 59 (76.62%) | 205 (71.68%) |
Total | 209 (100%) | 77 (100%) | 286 (100%) |
Education | 9-12 grade = 1 | 75 (35.89%) | 26 (33.77%) | 101 (35.31%) | 0.1259 | 0.939 |
Diploma = 2 | 96 (45.93%) | 37 (48.05%) | 133 (46.51%) |
Degree and above = 3 | 38 (18.18%) | 14 (18.18%) | 52 (18.18%) |
Total | 209 (100%) | 77 (100%) | 286 (100%) |
Poor pre loan saving | No poor pre loan saving = 0 | 107 (51.20%) | 73 (94.81%) | 180 (62.94%) | 0.0000*** | 45.8751 |
Presence of poor pre loan saving = 1 | 102 (48.80%) | 4 (5.19%) | 106 (37.06%) |
Total | 209 (100%) | 77 (100%) | 286 (100%) |
Inflations | No effect of inflation = 0 | 113 (54.07%) | 45 (58.44%) | 158 (55.24%) | 0.509 | 0.4355 |
Effect of inflation rise = 1 | 96 (45.93% | 32 (41.56%) | 128 (44.76%) |
Total | 209 (100%) | 77 (100%) | 286 (100%) |
Credit worthy of SMEs | No credit worth = 0 | 98 (46.89%) | 19 (24.68%) | 117 (40.91%) | 0.001** | 11.4871 |
Presence of credit worth =1 | 111 (53.11%) | 58 (75.32%) | 169 (59.09%) |
Total | 209 (100%) | 77 (100%) | 286 (100%) |
Access to electric service | Not access = 0 | 91 (43.54%) | 18 (23.38%) | 109 (38.11%) | 0.002** | 9.6997 |
Access = 1 | 118 (56.46%) | 59 (76.62%) | 177 (61.89%) |
Total | 209 (100%) | 77 (100%) | 286 (100%) |
Legend: * p<0.05; ** p<0.01; *** p<0.001 Source: Own computation from the survey data, 2025.
4.1.3. Institutional Characteristics
Awareness of lease financing: Participants and non-participants in the lease financing study area were also examined for this variable. Of the participants, 68.83% are unaware of lease finance, whereas 56.99% of respondents are unaware of it overall, compared to 52.63% of non-participants. According to the chi-square value, participants and non-participants differed significantly in their knowledge of lease financing at the 5% level of significance (
Table 4). Meghana et al.'s (2017) findings are no different. He discovers a positive correlation between lease financing practices and SMEs' financing, as well as the impact of ignorance on lease financing.
Access to electric service: This variable was examined for both participants and non-participants and was another important dummy variable. About 61.89% of the sampled respondents as a whole had used electric service, compared to 56.46% of non-participants and 76.62% of participants. According to
Table 4, the chi-square test revealed a significant difference between participants and non-participants at 5% significance level.
Business feasibility problem: Additionally, this variable was examined for both lease finance participants and non-participants in the study area. In the overall observation, 51.75% of respondents reported having a business feasibility issue, compared to 3.90% of participants and 69.38% of non-participants. At the 1% level of significance, the chi-square value shows that the difference between participants and non-participants on the business feasibility problem was very significant (
Table 4).
4.2. Econometric (Inferential) Result Analysis
4.2.1. Tests of the Probit Model
The data have been tested for goodness of fit, pairwise correlation and/or multicollinearity before estimating the model.
(i). Goodness of Fit Test
The Likelihood Ratio (LR) is used to test the model's fit. The probit model generated in
table 5 reported this test result by default. Because the LR test is statistically significant (i.e., χ2= 300.32, with P=0.0000), the generated model fits the data well.
(ii). Test for Multicollinearity
Before regressing, the model's variables were examined to see if multi-co linearity existed. For the multi-collinearity test of continuous and discrete (dummy) variables, the variance inflation factor and contingency coefficient were employed, respectively. According to
| [16] | Gujarati (2004). Basic Econometrics, (4th edition), McGraw Hill Companies. |
[16]
, continuous variables with a variance inflation factor (VIF) of less than 10 are generally seen to have no multicollinearity, whereas those with a VIF of more than 10 are problematic and ought to be removed from the model. There is no multicolinearity issue in this instance because the VIF values of all the variables taken into consideration are less than 10 (
Table 5).
Table 5. Result of Multi-colinearity Test for Continuous Independent Variables.
Variable | VIF | 1/VIF |
Exper | 1.30 | 0.767710 |
Cap | 1.25 | 0.799829 |
Size | 1.06 | 0.944214 |
Mean VIF | 1.20 | |
Source: Own computation from the survey data, 2025.
Additionally, the correlation matrix between discrete (dummy) variables is used to identify multi-collinerity issues. As a general rule, a variable with a contingency coefficient below 0.75 implies weak linkage, while a number over it suggests high association of variables. The contingency coefficient value goes from 0 to 1
| [17] | Gujarati. (2023). ESSENTIALS OF ECONOMETRICS FOURTH EDITIO. |
[17]
. Multi-collinearity was not a significant concern for this investigation because the contingency coefficients for the discrete variables included in the models were less than 0.75 (
Table 6).
Table 6. Result of pair-wise correlation Test for Dummy Independent Variables.
| Acctmar | Awa | Feas | Corru | Educ | Prelosa | Infl | Crwor | AcctEct |
Acctmar | 1.0000 | | | | | | | | |
Awa | -0.1326 | 1.0000 | | | | | | | |
Feas | -0.2897 | 0.0897 | 1.0000 | | | | | | |
Corru | -0.0008 | -0.2639 | 0.0634 | 1.0000 | | | | | |
Educ | 0.0990 | 0.0191 | -0.0359 | 0.0096 | 1.0000 | | | | |
Prelosa | -0.1790 | -0.1256 | 0.1905 | 0.2889 | 0.0424 | 1.0000 | | | |
Infl | -0.0427 | 0.0277 | 0.0107 | -0.0351 | -0.0106 | -0.0355 | 1.0000 | | |
Crwor | 0.1879 | -0.1103 | -0.1346 | 0.0337 | 0.0496 | 0.0495 | -0.0520 | 1.0000 | |
AcctEct | -0.0154 | 0.2018 | -0.0806 | -0.2577 | 0.0539 | -0.2773 | 0.0113 | 0.0499 | 1.0000 |
Source: Own computation from the survey data, 2025.
4.2.2. Factors Affecting Participation of Lease Financing of SMEs
To assess the determinants influencing lease finance participation in the research area, a probit model has been conducted. The appropriateness of the model has been checked. The probit model's excellent explanatory ability is demonstrated by its significant likelihood function (χ2= 300.32, with P=0.0000).
Table 7 displays the outcomes of the probit model together with their marginal effects.
Seven of the twelve explanatory factors were found to significantly affect the probability of participation decision of lease financing, at varying significance levels and in varying directions, according to the model's results, which are displayed in
table 7. A number of factors, including market accessibility, company viability issues, SMEs' capital, managers' expertise, inadequate pre-loan savings, SMEs' size, and creditworthiness, significantly impact the likelihood of participation. These factors have varying effects on SMEs' decisions to participate.
Table 7. Estimated Probit Model for Lease Financing.
Probit Regression model Log likelihood Ratio= -16.434297 | Number of obs = 286 LR chi2 (13) = 300.32 Prob> chi2 = 0.0000 Pseudo R2 = 0.9014 |
Variables | Coef. | Std. Err | Z | P>│Z│ | Marginal effects |
AcctMar | 3.053613* | 1.188287 | 2.57 | 0.010 | 0.0143344 |
Awa | -0.7637082 | 0.6273737 | -1.22 | 0.223 | -0.0004238 |
Feas | -3.50186*** | 0.9914475 | -3.53 | 0.000 | -0.0350363 |
Cap | 2.90e-06** | 1.00e-06 | 2.89 | 0.004 | 1.78e-09 |
Corru | 0.7862756 | 0.8795064 | 0.89 | 0.371 | 0.001066 |
Edu | | | | | -0.0001672 |
2 | -0.0474202 | 0.6323388 | -0.07 | 0.940 |
3 | -0.8508445 | 1.106795 | -0.77 | 0.442 |
Exper | 0.5071734** | 0.1590691 | 3.19 | 0.001 | 0.0003155 |
Prelosa | -3.952499* | 1.700796 | -2.32 | 0.020 | -0.0142723 |
Infl | -1.020783 | 0.7914889 | -1.29 | 0.197 | -0.0008965 |
Size | 0.1497419* | 0.0700554 | 2.14 | 0.033 | 0.0000955 |
Crwor | 1.674399* | 0.7492623 | 2.23 | 0.025 | 0.0017047 |
AcctEct | 0.6627959 | 0.7542248 | 0.88 | 0.380 | 0.000332 |
_cons | -8.294818 | 2.557478 | -3.24 | 0.001 | |
For discrete variables the marginal effect is the change of dummy variable from 0 to 1
Legend: * p<0.05; ** p<0.01; *** p<0.001
Source: Own computation from the survey data, 2025.
Access to market: SMEs' decision to participate in lease financing was found to be highly influenced by their access to the market at a 5% probability level. The decision of SMEs to participate in lease financing was positively impacted. SMEs with market accessibility have a 1.43% higher predicted likelihood of engaging in lease finance than SMEs without market accessibility, according to the marginal effect of this variable, which is 0.0143. In other words, the chance of participating in lease financing increases by 1.43% when market access shifts from "not access" to "market access." The results obtained by this researcher are comparable with others too
| [21] | Kinfe, A., Chilot, Y., & Rajan, S. 2012. Effect of small-scale irrigation on the income of rural farm households: the case of Laelay Maichew district, central Tigray, Ethiopia. Journal of Agricultural Science, 7(1). |
[21]
. The decision of SMEs to participate in lease financing has been positively and considerably impacted by market accessibility, according to multiple researches, they said.
Business feasibility problem: According to
Table 7, the presence of business feasibility issues among the sampled SMEs had a negative and significant impact on the decision to participate in lease finance at the l% significance level. Accordingly, the sampled SMEs with no business feasibility issues are more likely to engage in lease finance than those with such issues. SMEs with business feasibility issues had a 3.50% lower probability of participating in lease finance than those without such issues, according to the marginal effect, when all other factors were held constant at their mean values. Numerous scholars have also found the same outcome with this researcher's findings, including
| [12] | Fabowale, L., Orser, B., Riding, A., and Swift, C. (1994). Gender and banking with the small business client. Canadian Woman Studies, 15(1). |
[12]
. Business feasibility issues, they claim, make it more difficult for SMEs to obtain lease finance. This indicates that SMEs' participation in lease financing is impeded by their inability to make their businesses feasible.
Capital: At a significance level of less than 5%, it was discovered that the SMEs' capital had a favorable and significant impact on their decision to participate in lease financing. As the capital of SMEs increases by one Birr, the estimated marginal effect of this variable shows that, when all other factors are held constant at their mean values, the chance of engaging in lease financing of sampled SMEs increases by approximately 1.78e-07% (0.000000178%) (
Table 7). Additionally, several researchers' findings concur with this researcher's. The results of these studies demonstrate that this variable has a favorable and significant impact on SMEs' involvement in lease financing
| [21] | Kinfe, A., Chilot, Y., & Rajan, S. 2012. Effect of small-scale irrigation on the income of rural farm households: the case of Laelay Maichew district, central Tigray, Ethiopia. Journal of Agricultural Science, 7(1). |
[21]
.
Experience: At the less than 5% level of significance, it was discovered that the managers' experience had a favorable and significant impact on their involvement in leasing finance. The correlation between managers' experience and lease finance is demonstrated by the value of this variable's coefficient. However, the marginal effect finding shows that, while other variables remain at their mean values, the probability of SMEs participating increases by 0.032% for every year that SMEs managers' experience increases (
Table 7). This suggests that managers with more experience participate in lease finance at a higher rate. Additionally, it has a beneficial relationship with lease finance procedures
| [13] | Fredu Negaand Edris Hussein (2016). Small and Medium Enterprise Access to Finance in Ethiopia: Synthesis of Demand and Supply, Addis Ababa, the Horn Economic and Social Policy Institute. |
[13]
.
Size of SMEs: At the less than 5% significance level, it was discovered that this variable had a positive and significant impact on the SMEs' decision to participate in lease finance. The calculated marginal effect of this variable shows that when SMEs grow by one employee, the likelihood of taking part in lease finance rises by roughly 0.001%, while all other factors remain at their mean values (
Table 7). Additionally, studies have shown that SMEs with more employers engage in lease finance at higher rates than their counterparts
| [2] | Befekadu Nigussie. (2018). Assessment Of Lease Financing In Ethiopia Among BE, ACGFC And OCGFC. (Degree Of Masters Of Science Dissertation, University Of Addis Ababa, 2018). |
[2]
.
Credit worthy SMEs: According to
Table 7, this variable also has a favorable and significant impact on the decision to participate in leasing financing at a significance level below 5%. This demonstrates that participating in lease financing is more likely for the sampled SMEs with creditworthiness than for those without. SMEs with creditworthiness had a 0.17% higher probability of participating in lease finance than those without creditworthiness, according to the marginal effect, which holds all other factors fixed at their mean values.
Poor Per-Loan Saving:- The decision of SMEs to participate in lease finance is significantly impacted by this variable, which was also determined to be negatively significant at a significance level of less than 5%. This suggests that SMEs in the sample who have low per-loan savings are more likely than those with high per-loan savings to choose not to use lease financing. SMEs with low pre-loan savings were more likely to not engage in lease financing by 1.43% than those with high pre-loan savings, according to the marginal effect, which holds all other factors constant at their mean values.
4.2.3. Factors Influencing the Intensity of Lease Financing Participation
Using Heckman's two-step techniques, the intensity of lease financing participation was conducted. Because the value of lamda (
) = 0.013 is less than 0.05 and appropriate to measure the intensity of involvement by Hackman two step, the model's inverse mills ratio (IMR) was significant, according to the results. Six of the 12 explanatory variables were found to significantly influence the degree of lease finance participation, at varying significance levels and in different directions, according to the model's results, which are displayed in
table 8. These factors include market accessibility, SMEs' capital, corruption, manager experience, inflation, and electricity availability.
Access to Market: At the 1% level of significance, it was also discovered that this variable had a significant and beneficial impact on the amount of participation in the supply of machinery. According to the Heckman selection model, the supply of machinery for SMEs rises by 2.15 units for every discrete change in this variable from 0 to 1 (i.e., from SMEs who do not enter the market to SMEs that do) (
table 8).
Capital of SMEs: As anticipated, the study found that the capital of the sampled SMEs had a positive and significant impact on their level of lease financing participation at a significance level of less than 5%. The model's coefficient for the variable, as displayed in
table 8, indicates that, when all other variables are held constant, the supply of machinery increases by 0.000001% for every birr increase in SMEs' capital (9.31e-07).
Corruptions: With the other variables in the model held constant at their mean values, the variable's coefficient indicates that SMEs with no corruption have a 1.11-unit higher chance of supplying machinery than SMEs with corruption problems (
table 8). This is in line with the hypothesis that the variable has a negative and statistically significant relationship to the probability of SMEs supplying machinery in lease financing, as confirmed by Heckman two-step results.
Managers Experience: At the 1% significance level, this variable was found to significantly and favorably influence the amount of engagement. This means that for every year that managers of SMEs gain expertise, the percentage of machinery supply rises by 0.183 units, assuming all other parameters remain same. In other words, SMEs with more seasoned management are more likely to have access to machinery than those with less experience in the field under investigation (
Table 8).
Access to electricity: At the 5% level of significance, this variable was also found to have a significant and favorable impact on the intensity of participation in the supply of machinery. For a discrete change in this variable from 0 to 1 (changes from the SMEs that did not access electric service to the SMEs that accessed electric service), the Heckman selection model's result shows that the percentage of machinery supply in SMEs improves by 0.73 units (
table 8).
Inflation: The Heckman two-step results support the hypothesis that the likelihood of SMEs being able to purchase machinery is negatively and statistically substantially correlated with inflation increases at the 1% significance level. The variable's coefficient indicates that, when all other variables are held constant at their mean values, SMEs without an inflation problem are 0.91 units more likely to supply machinery than SMEs with an inflation problem (
table 8).
Table 8. Estimated Heckman Two Step Model.
Heckman selection Model - -two - step estimates | Number of obs = 286 Wald chi2 (14) = 91.88 Selected = 77 Prob> chi2 = 0.0000 Non-selected = 209 |
MSupp | Coef. | Std. Err | Z | P>│Z│ |
AcctMar | 2.145171*** | 0.4564464 | 4.70 | 0.000 |
Awa | -0.3310824 | 0.2815681 | -1.18 | 0.240 |
Feas | -0.6472555 | 0.6624147 | -0.90 | 0.329 |
Cap | 9.31e-07** | 3.05e-07 | 3.05 | 0.002 |
Corru | -1.106968*** | 0.3165942 | -3.50 | 0.000 |
Edu | | | | |
2 | 0.2241812 | 0.2789345 | 0.80 | 0.422 |
3 | -0.673242 | 0.3540618 | -1.90 | 0.057 |
Exper | 0.1826199*** | 0.0387804 | 4.71 | 0.000 |
Prelosa | -0.6670385 | 0.5725692 | -1.16 | 0.244 |
Infl | -0.9096788*** | 0.2466464 | -3.69 | 0.000 |
Size | -0.0044263 | 0.0192993 | -0.23 | 0.819 |
Crwor | 0.1765454 | 0.2954296 | 0.60 | 0.550 |
AcctEct | 0.7257144* | 0.2977701 | 2.44 | 0.015 |
_cons | -1.144536 | 0.8681134 | -1.32 | 0.187 |
/Mills lamda | 1.010423* | 0.4067519 | 2.48 | 0.013 |
Rho | 0.97950 |
sigma | 1.0315731 |
For discrete variables the marginal effect is the change of dummy variable from 0 to 1
Legend: * p<0.05; ** p<0.01; *** p<0.001
Source, Own Computation from survey data, 2025
4.3. Consequence of Lease Financing on SMEs Income
The assessment of the impact of SMEs' involvement in lease financing on their revenue is the focus of this subsection. Due to the lack of baseline data, the evaluation in this specific case study was carried out using the propensity score matching (PSM) technique of impact evaluation. The four stages of PSM are: calculating the propensity score for each unit in the sample, or the probability of participation; choosing a matching algorithm to create a comparison group by pairing participants with non-participants; ensuring that the characteristics of the treatment and comparison groups are balanced; calculating the program effect and interpreting the findings
| [20] | IMF. (2013). Ethiopia Country Report No. 13/308. NA: IMF. |
[20]
. Thus, this paragraph presents the aforementioned primary difficulties.
4.3.1. Estimation of Propensity Score
Any model that links a set of predictors to a binary variable can be applied. Consequently, propensity scores can be created using a logit or probit regression to estimate the likelihood that a unit will be exposed to the program or assigned to it, as well as the likelihood that it will participate in lease financing, contingent on a set of observable characteristics that may influence such participation. Since logit regression is the most often used model for propensity score estimate, it is used in this study to calculate the propensity scores
. The mean difference between the outcomes of the two groups is then used to compute the average treatment effect.
This validity of PSM depends on:
1) Conditional independence.
2) Sizable common support or overlap in propensity score across the two groups in the sample SMEs.
Therefore, calculating the propensity score and common support region (balancing property) is the first step in establishing the average treatment effect on treated (ATT). To determine whether a common support or overlap region exists, the logistic regression model result was used to calculate the dissemination of propensity score for each SME included in the lease financing participant and non-participant groups (0 < p (D =1 X < 1 should be tested). According to the logistic regression model's results, which are shown in
table 9, seven of the eleven covariates were significant. Following iteration with a logit model that satisfied the common support region (balancing property), all explanatory variables were then found.
Table 9. Logistic regression result to find common support.
Variable | Coef | Std. Err | Z | P>|z | |
AcctMar | 5.375248* | 2.208252 | 2.43 | 0.015 | Logistic regression Number of obs = 286 LR chi2(11) = 299.05 Prob> chi2 = 0.0000 Log likelihood = -17.06753 Pseudo R2 = 0.8975 |
Awa | -1.064633 | 1.021937 | 1.04 | 0.298 |
Feas | -6.000867*** | 1.713992 | 3.5 | 0 |
Cap | 5.08e-06** | 1.77E-06 | 2.88 | 0.004 |
Corru | 0.9730447 | 1.469661 | 0.66 | 0.508 |
Exper | .9018258** | 0.2901632 | 3.11 | 0.002 |
Prelosa | -6.916752* | 2.882165 | 2.4 | 0.016 |
Infl | -1.59318 | 1.24767 | 1.28 | 0.202 |
Size | 2779608* | 0.1204522 | 2.31 | 0.021 |
Crwor | 2.755779* | 1.255485 | 2.19 | 0.028 |
AcctEct | 0.65832 | 1.139742 | 0.58 | 0.564 |
_cons | -14.75226 | 4.482937 | 3.29 | 0.001 |
Source: Own computation from survey result data, 2025
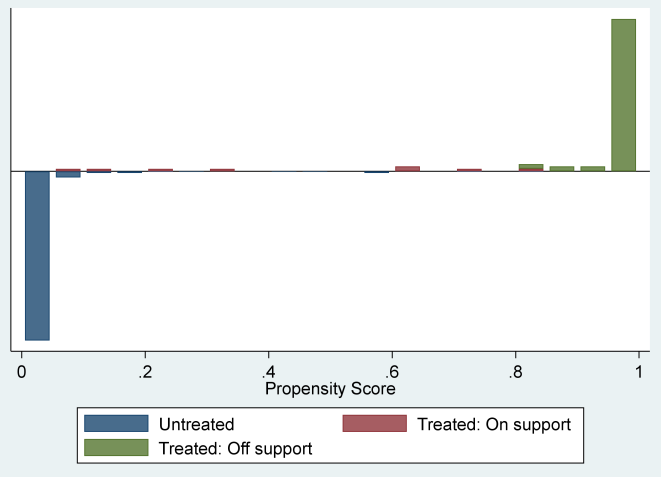
Following the estimation of propensity using explanatory variables, the propensity score of participants and non-participants in lease finance was used to enforce the common support zone. The propensity score and common support region are displayed in
Figure 3 below. Participating SMEs are displayed in the upper half, while non-participant SMEs are displayed in the lower half. Observations in lease finance participants and non-participants were represented by the red (treated: on-support) and blue (untreated: on-support) colors, respectively. Green (treated: off support) indicates leasing financing participation observations without comparison.
Figure 3. Region of common support between treated and untreated.
4.3.2. Selecting a Matching Algorithm
Following the estimation of propensity scores, units in the treatment group (beneficiaries) are paired with non-beneficiaries who share a comparable propensity score, or likelihood of taking part in the program. When doing the consequence/impact evaluation to determine the treatment's effect, a variety of matching algorithms can be used. The most widely used matching algorithms in PSM are kernel matching, radius matching, and nearest neighbor matching. These matching techniques employ various techniques to match the beneficiaries to the control group in order to calculate the average impact of a particular intervention or program participation.
To test across the matching algorithms and within the matching method under various conditions (varying caliper distance and number of nearest neighbor), three popular matching algorithms in PSM were tested using various criteria. The number of matched observations, the number of balanced covariates, the mean bias, the matching techniques, and the pseudo R square value for best closest neighbor matching, radius matching, and kernel matching are all tested simultaneously. When compared to other matching algorithms, nearest neighboring matching is the best estimator in this study because it has the lowest mean bias, lowest pseudo R square, roughly equal number of matched observations, and equal number of balanced covariates.
Furthermore, it is desirable to use a matching technique that balances all of the groups' explanatory factors because it produces a large sample size and a low pseudo R2 value
| [10] | Dehejia, R. H. and Wahba, S. (2002) Pro-pensity score matching methods for nonexperimental causal studies. |
[10]
. The values of mean bias, pseudo R square, number of matched observations, and number of balanced covariates are 13.6, 0.049, 217, and 11, respectively, as indicated in
table 10 below. Because it is the best matching algorithm, nearest neighboring matching at 4 was chosen. In order to quantify the influence or consequence of participating in lease finance of SMEs' income, the nearest neighboring matching algorithm was chosen as the optimal matching algorithm under PSM.
Table 10. Tests on propensity score matching algorithms.
Matching Algorithm | Mean Bias | Pseudo R square | No. of matched observation | No. of balanced Covariates |
Nearest Neighbor | | | | |
Neighbor 1 | 28.8 | 1 | 217 | 11 |
Neighbor 2 | 17.0 | 0.091 | 217 | 11 |
Neighbor 3 | 18.2 | 0.085 | 217 | 11 |
Neighbor 4 | 13.6 | 0.049 | 217 | 11 |
Neighbor 5 | 13.8 | 0.068 | 217 | 11 |
Radius | | | | |
0.01 | 16.4 | 1 | 213 | 11 |
0.1 | 16.7 | 0.074 | 217 | 11 |
0.25 | 20.9 | 0.073 | 217 | 11 |
0.5 | 28.9 | 0.137 | 217 | 11 |
Kernel | | | | |
bwidth 0.01 | 16.6 | 0.405 | 217 | 11 |
bwidth 0.1 | 19.6 | 0.071 | 217 | 11 |
bwidth 0.25 | 36.3 | 0.230 | 217 | 11 |
bwidth 0.5 | 50.5 | 0.616 | 217 | 11 |
Source: Own computation survey result data, 2025
4.3.3. Checking for Balance
The matched units in the treatment and comparison groups should be statistically equivalent, meaning that once the units are matched, the features of the created treatment and comparison groups shouldn't differ considerably. To ascertain whether the means in the treatment and comparison groups are statistically similar, the means of all covariates that are part of the propensity score are compared using the t-test. When the assessor is worried about the results' statistical significance, the t-test is the recommended test
| [29] | Solivas ES, Ramirez GM, Manalo AN (2007). The propensity score matching for correcting sample selection bias. In 10th National Convention on Statistics (NCS), EDSA Shangri-La Hotel, Mandaluyong City, Philippines pp. 1-2. |
[29]
.
Until the sample is adequately balanced, an alternative matching option or specification should be used if balance is not reached, that is, if the covariate means are statistically different. It was shown that the t-test satisfies the balanced test of the covariates for this study, which checks for balance in the mean of the covariates between participants and non-participants. In addition to the statistical test mentioned above, the absolute standardized differences of the covariate means must be less than 25% for the balance of covariates to be considered reliable. Because the individual covariates mean difference between participants and non-participants is less than 25%, this condition has also been met. The test of balance covariant for this study is shown in
Table 11.
Table 11. Test of balance of covariates after matching.
Variables | Unmatched | Mean | % reduct | t-test |
Matched | Treated | Control | % bias | │bias│ | T | p>│t│ |
AcctMar | U | 0.90909 | 0.39234 | 128.5 | 75.8 | 8.71 | 0.000 |
M | 0.75 | 0.875 | -21.1 | -0.61 | 0.554 |
Awa | U | 0.31169 | 0.47368 | -33.5 | 61.4 | -2.47 | 0.014 |
M | 0.375 | 0.4375 | -12.9 | -0.24 | 0.815 |
Feas | U | 0.03896 | 0.69378 | -184.7 | 95.2 | -12.04 | 0.000 |
M | .025 | 0.28125 | -8.8 | -0.13 | 0.897 |
Cap | U | 6.2e+05 | 1.9e+05 | 125 | 94.1 | 12.12 | 0.000 |
M | 2.9e+05 | 3.2e+05 | -7.4 | -0.14 | 0.887 |
Corru | U | 0.23377 | .30144 | -15.3 | -38.5 | -1.13 | 0.261 |
M | 0.25 | 0.15625 | 21.1 | 0.44 | 0.667 |
Exper | U | 10.039 | 3.8469 | 206.1 | 88.4 | 16.70 | 0.000 |
M | 6.25 | 5.5313 | 23.9 | 0.48 | 0.637 |
Prelosa | U | 0.05195 | 0.48804 | -112.4 | 100.0 | -7.37 | 0.000 |
M | 0 | 0 | 0.0 | - | - |
Infl | U | 0.41558 | 0.45933 | -8.8 | 28.6 | -0.66 | 0.511 |
M | 0.5 | 0.53125 | -6.3 | -0.128 | 0.90 |
Size | U | 15.766 | 11.703 | 64.2 | 82.3 | 5.09 | 0.000 |
M | 14 | 13.281 | 11.4 | 0.22 | 0.830 |
Crwor | U | 0.75325 | 0.5311 | 47.4 | 57.8 | 3.45 | 0.001 |
M | 0.5 | 0.59375 | -20.0 | -0.35 | 0.729 |
AcctEct | U | 0.76623 | 0.56459 | 43.6 | 84.5 | 3.16 | 0.002 |
M | 0.75 | 0.71875 | 6.8 | 0.13 | 0.897 |
Source: Source: Own survey result, 2025
There was no significant difference between the two groups on the covariates after matching, according to the results of testing for covariate balance between the treatment and comparison groups. This is because the t-test indicates that there were no significant covariates. Consequently, the covariate balancing requirements are met.
4.3.4. Consequence of Lease Financing Participation on SMEs Income
When baseline data is unavailable, the aforementioned propensity score matching stages are used to estimate the impact of a particular program intervention. The impact of the intervention can be calculated by averaging the changes in outcome between each treated unit and its neighbor from the created comparison group after propensity score estimation, matching algorithm implementation, and balance achievement. The program's effect can then be seen as the difference in averages between the subjects who took part in the intervention and those who did not. Using nearest neighbor matching at n (4) neighbors from
Table 11 above, the average treatment effect on the treated of participation in leasing finance participation was evaluated as a consequence of this investigation. According to the findings, taking part in lease finance increased participants' income by ETB 32,598.44. The findings show that lease finance significantly and favorably affects SMEs' revenue. As a result, it can be said that lease financing participation raised SMEs' average yearly income by 36.1% (
table 12).
Table 12. Estimates of the average treatment effect of lease financing on SMEs income.
Variable | Treated | Controls | Difference | S.E. | T-stat |
Income Unmatched | 197,543.117 | 37,726.2488 | 159,816.868 | 10,775.8983 | 14.83 |
ATT | 90,388.75 | 57,790.3125 | 32,598.4375 | 30,807.6516 | 2.06 |
Source: Own survey result, 2025
4.3.5. Robustness Test Result of Average Treatment Effect on Treated
According to the robust test result in
table 13, the average annual revenue gain of SMEs through lease financing grew by ETB 159,000, ETB 69,802.69, and ETB 162,000, respectively, as determined by the nearest neighbor, radius, and kernel matching algorithms.
Table 13. Robustness test result of ATT.
Types works Outcome Matching |
| Algorithm | n. treat | n. control | ATT | Std. Err. | T |
Income | Nearest | | | | | |
neighbor | 77 | 6 | 1.59e+05 | 60,278.688 | 2.640 |
Radius | 12 | 11 | 69,802.672 | 43,031.185 | 1.622 |
Kernel | 77 | 12 | 1.62e+05 | 42,873.475 | 3.778 |
Source: Own survey result, 2025
The average treatment effect on treated (ATT) report for each of the three outcomes was a favorable and noteworthy finding. This result demonstrated that the matching procedure chosen to assess the average treatment effect on treated individuals was suitable for this investigation and that the ATT result was reliable.
5. Summary, Conclusions and Recommendations
5.1. Summary
A lease is a type of in-kind financing for production and service purposes in which a lessor provides a lessee with specific capital goods on a financial lease or hire purchase agreement basis, without the need for collateral, for a predetermined amount of time in exchange for a predetermined amount of periodic payments over that time. In essence, leasing distinguishes between an asset's economic use and its legal ownership. By concentrating on the side variables that prevent SMEs from participating in lease financing, the primary goal of this study was to examine the factors influencing lease finance participations and their effects on SMEs' revenue. The study was supported by both primary and secondary data. The purposive selection method was used to choose the research population's responders. Accordingly, out of the 1000 SMEs in the study area, 286 sample SMEs were selected. Descriptive statistics, the Probit model, the Heckman two-stage model, and Propensity Score Matching (PSM) were used to analyze the gathered data. The study discovered that SMEs' participation decisions are considerably and favorably impacted by their managers' experience, their size, capital, market accessibility, credit worthiness, and business viability. Additionally, SMEs' decisions to participate in lease finance are severely and adversely impacted by inadequate pre-loan savings.
5.2. Conclusion
Financing SMEs through lease financing promotes economic development by generating money and jobs, replacing imports, and encouraging exports. However, in the research area, lease finance services are not widely used or taken into account. According to the study's findings, the following factors have a major impact on SMEs' lease finance participation in the study area: SME manager experience, SME size, SME capital, market accessibility, low pre-loan savings, SME credit worthiness, and business feasibility issues.
However, SMEs' capital has a big impact on their income and involvement in lease financing. Compared to SMEs with low capital, those with higher capital are more likely to participate in lease financing. This demonstrates that SMEs' initial capital, which is employed as working capital and equity investment, is necessary for leasing financing. Both participation and non-participation in lease finance of SMEs are not considerably impacted by access to energy. This demonstrates that the providing body's machinery benefits greatly from the availability of energy. It suggests that the likelihood of obtaining machinery with 0.73 units rises with increased accessibility to electric power. There is no discernible relationship between lease financing participation and non-participation and factors such as educational attainment, inflation, corruption, and SME awareness of lease financing. These factors don't affect SMEs' involvement in lease finance.
SME involvement in lease financing has been adversely affected by low pre-loan savings. Accordingly, SMEs without per-loan savings are not eligible for gate lease financing. Participation in lease financing is reduced by 1.43% for SMEs without per-loan savings. Those with low per-loan savings have a 1.43% higher likelihood of not participating in the other rounds. The degree of participation (machinery supply) is positively impacted by SMEs' capital, experience, market accessibility, and electric service accessibility by 0.83%, 0.000001%, 2.15 units, and 0.73 units, respectively. However, the level of involvement (machines supply) is negatively impacted by rising inflation and corruption by 0.91 and 1.11 units, respectively. Additionally, the income of SMEs that take part in lease financing rises by 32,598.44 (36.6%) of their capital per year.
5.3. Recommendation
Planning and implementing associated programs to address the difficulties of lease finance in our nation requires an understanding of the factors that influence lease financing practices. Therefore, in order to improve SMEs' participation in lease financing services, policymakers and planners must have a thorough understanding of SMEs' needs and their capacity to acquire lease financing services in order to develop a practice that works for them.
Per- Loan Saving:- Based on the study's findings, the following policy recommendation can be implemented to further examine and enhance lease finance procedures in the Kellem Wollega zones, as well as in other regions of the nation. Even though the study found that participation in lease financing could increase SMEs' income from lease financing projects and concurrently contribute to the nation's economic growth, capital good financing companies (DBE Dambi Dollo Branch) and government bodies (Government Revenue Office, and certain microfinance institutions) have not done enough to raise awareness about pre-loan saving in order to make lease financing accessible to potential SMEs in the study area. Therefore, in order to encourage potential SMEs to take advantage of the lease financing services that are accessible in the study region, Capital Good Financing Company (DBE Dambi Dollo Branch) and relevant government bodies must pay attention to providing pre-loan saving knowledge for lease financing.
Size of SME:- Given that many employers are required to participate in SMEs' lease financing and that this is a chance to reduce unemployment, it is prudent to give SMEs' development the attention it deserves. A high number of employers might occasionally be interpreted as a sign of social standing. Because of their social standing, those SMEs might be more inclined to engage in lease financing in order to preserve their standing in the community. Therefore, SMEs require the attention of both governmental and non-governmental organizations.
Making Market accessible:- Increasing SMEs' involvement in lease financing is crucial. This is because SMEs' participation in lease financing is influenced by their access to the market. Therefore, it would be better for a government agency or other nonprofit group to focus on facilitating market accessibility for prospective SMEs. The likelihood that SMEs will participate in lease finance will occasionally rise if market accessibility improves.
Business Feasibility:- Government and nongovernmental organizations should focus on developing business plans and conducting feasibility studies for small and medium-sized enterprises. SMEs' involvement in lease financing has been positively impacted by the availability of business plan viability. Therefore, SMEs should try their best to have well-trained personnel on hand to prepare a feasible business plan in order to mitigate the problem of business plan feasibility. Additionally, since the feasibility of business plans has a significant impact on SMEs' participation in lease finance, relevant bodies should train prospective SMEs in order to further increase SMEs' participation in lease financing.
Business Manager’s experience:- It significantly impacts the ability to obtain credit from official financial organizations. Governmental and non-governmental organizations should endeavor to raise awareness and make it easier for people with less experience—such as start-up entrepreneurs with minimal background in business—to receive further training.
Capital of SME:- Enhancing SMEs' ability to save is crucial since their involvement in lease finance and the revenue they receive from these projects are influenced by the firm's capital. SMEs' capital is crucial to the growth of their companies. In order to apply for lease finance services, it serves as working capital and equity contribution. Equity from SMEs' potential is necessary for any capital good finance companies. Therefore, in order to engage in leasing financing services, SMEs should increase their saving capacity. To increase their savings and involvement in leasing finance, the government and other nongovernmental organizations should provide guidance and training on how to manage financial records.
Credit worthiness of SME:- Encourage and constantly monitor SMEs to keep accurate books of accounts; they should also work on creating reliable financial statements that accurately reflect their company structure. This can aid in the analysis and decision-making of the leasing organization that offers SME lease finance. In order for SMEs to effectively participate in lease finance, they must engage individuals who are well-versed in financial statement creation and other related sectors. Government agencies and other relevant authorities should also give adequate attention to providing training in these areas.